Read our latest: The year so far & 1.0 update.
For a recent hack day Andy Berry and I decided to add opt-in anonymous usage tracking to the BladeRunnerJS toolkit. We used Keen IO to capture, analyse and visualise the statistics, and Pusher to add realtime updates to BladeRunnerJS dashboard app we built.
In this post I'll cover why we wanted to do this and how it was achieved. You can also take a look at the Live BRJS Usage Dashboard.
You can put in a lot of time and effort into open sourcing a project. There are many intangable benefits from the open sourcing process that I'm not going to go into here, but one thing you generally hope for is that your project will gain some traction which should be measurable. Some projects take off instantly and you can measure success through project watchers, stargazers, issues raised and pull requests, user-contributed plugins or blog posts about what people have built with your project. Not every project is an instant success and BladeRunnerJS falls into this category.
We initially open sourced on October 30th 2013. Now - one year later - we're very close to a v1.0 release and we do have some encouraging stats:
794 downloads is a particularly exciting - yet frustrating - statistic. After people download the BladeRunnerJS toolkit what do they do with it?
After people download the BladeRunnerJS toolkit what do they do with it?
One of the problems with the project being open source is that there isn't any sign-up process. Developers anonymously download the BRJS zip and that's it. So, we decided to try to answer this question and in a recent Caplin Systems hack day.
The BladeRunnerJS toolkit offers a plugin architecture that exposes an application model. The model is a logical representation of your BRJS application, providing an above-the-file-system abstraction of how your app maps to some of the BladeRunnerJS concepts such as blades and services. In addition, it provides a mechanism to listen into - and augment - development workflow steps such executing tests (the test runner) or those in the build process like the bundling JavaScript.
For the hack day we created a plugin that hooks into some of the events exposed by the model and stored them using a custom analytics service called Keen IO.
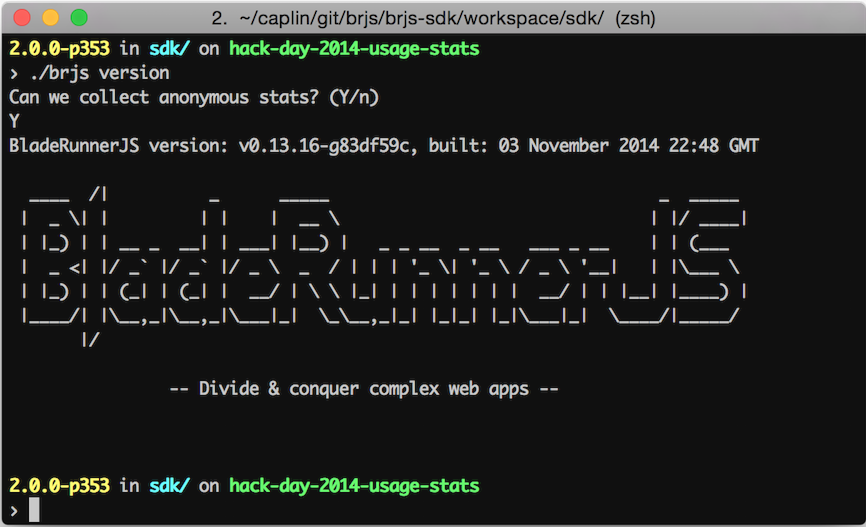
The first time that a developer uses BRJS after downloading it they will be prompted to check if they mind sharing some anonymous usage stats. The answer is persisted to a config file and then if they've answered yes we store some initial stats. From that point on we can also record usage stats. We record the following:
installs - As soon as the developer answers yes we grab info such as toolkit version, Java version, OS and versioncommands - Command executions e.g. ./brjs serve or ./brjs test ...bundlesets - Application bundling (building) and app sizes e.g. when somebody runs a workbench, runs an aspect or builds the appStoring to Keen IO is amazingly simple. It just involves a simple call to their API. They do provide a number of SDKs but the API is so easy we didn't need it. Any time an event that we want to track occurs we can store it as follows:
private void trackEvent(Map<String,Object> eventData, String eventType) {
    try
    {
        String jsonBlob = new Gson().toJson(eventData);
        HttpClient client = HttpClientBuilder.create().build();
        HttpPost keenIOPost = new HttpPost("https://api.keen.io/3.0/projects/" + KEENIO_PROJECT_ID + "/events/" + eventType + "?api_key=" + KEENIO_APP_KEY);
        keenIOPost.setHeader("Content-Type", "application/json");
        keenIOPost.setEntity( new StringEntity(jsonBlob) );
        client.execute(keenIOPost);
    }
    catch (Exception e)
    {
        brjs.logger(this.getClass()).error(e.toString());
    }
}
In the above code the eventType maps to the type of data that we are collecting e.g. installs, commands and bundlesets.
With that - and assuming a few developers will say "yes" to letting us collect data - we will now be storing some data that will help us understand how developers are using BRJS. So, how do we now get at that data and visualise it?
With the data safely stored away in Keen IO we now need a way of extracting that data and displaying it in a way that makes it easy visualise and make decisions from the data. We need a dashboard. Luckily Keen IO recently released a number of dashboard templates.
the Keen IO SDK removes the pain of taking the data you have and putting it into the structure required for your charting library of choice
Keen IO also provide a powerful JavaScript SDK for querying and visualising the data. One of the things I particularly like is that it removes the pain of taking the data you have and putting it into the structure required for your charting library of choice (I've seen Google and ChartJS listed so far).
Once you've included the Keen IO JavaScript SDK fetching and displaying data is as simple as first building a query:
var client = new Keen( { projectId: KEEN_PROJECT_ID,
                                                 readKey: KEEN_READ_KEY } );

var query = new Keen.Query("count", {
    eventCollection: 'installs',
    groupBy: 'os_name'
} );
The example above we're querying the installs collection and getting a count of operating systems (os_name) that BRJS has been installed on.
The data is then visualized by executing the query and creating a new Keen.Visualization and adding the resulting chart to the and element with an id of os-info-name:
client.run( query, function() {
    new Keen.Visualization( this, document.getElementById( 'os-info-name' ), {
      chartType: 'piechart',
      title: 'OS Name'
    } );
} );
Note: The SDK is pretty flexible and provides a number of ways of achieving the same result
Here's what the above code produces:
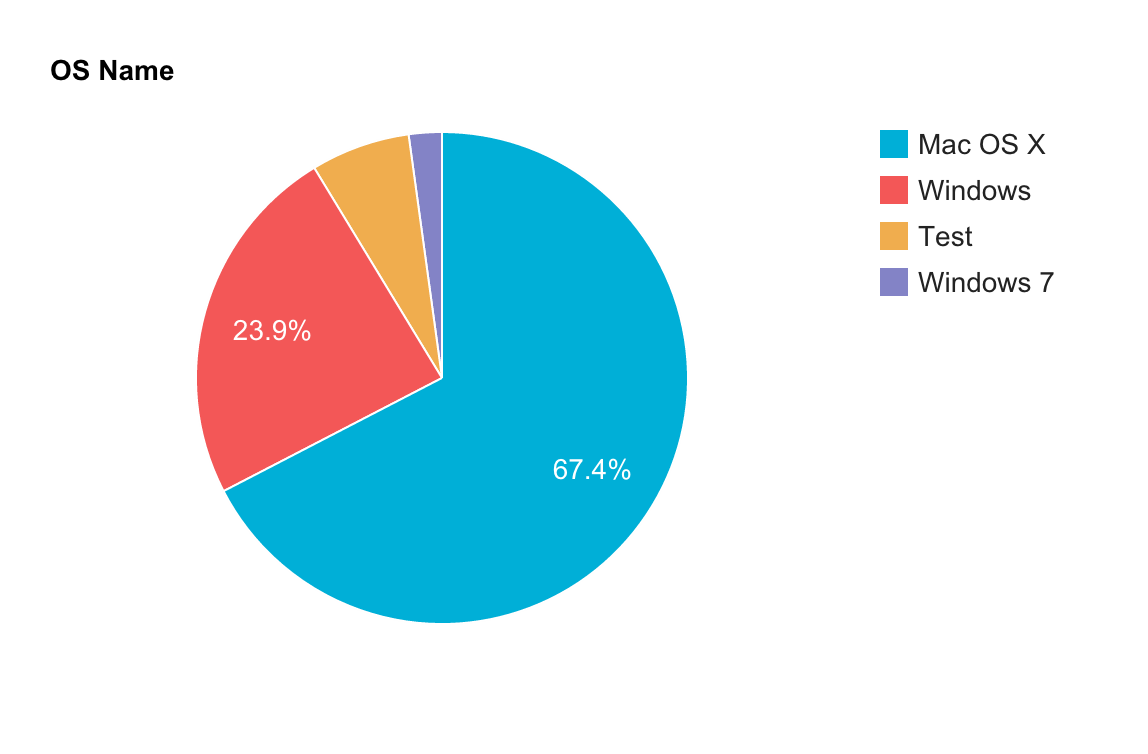
Note: Until we roll this plugin into a BRJS release you may see some test data
We can obviously then build up all the different visualisations that we want from the data we're storing.
For the BladeRunnerJS Usage Dashboard app we created multiple blades, each representing a set of data that we want to visualise.
By building them in blades it meant that Andy and I could work in parallel in getting all seven of the visualisations complete in as fast a time as possible during the hack day.
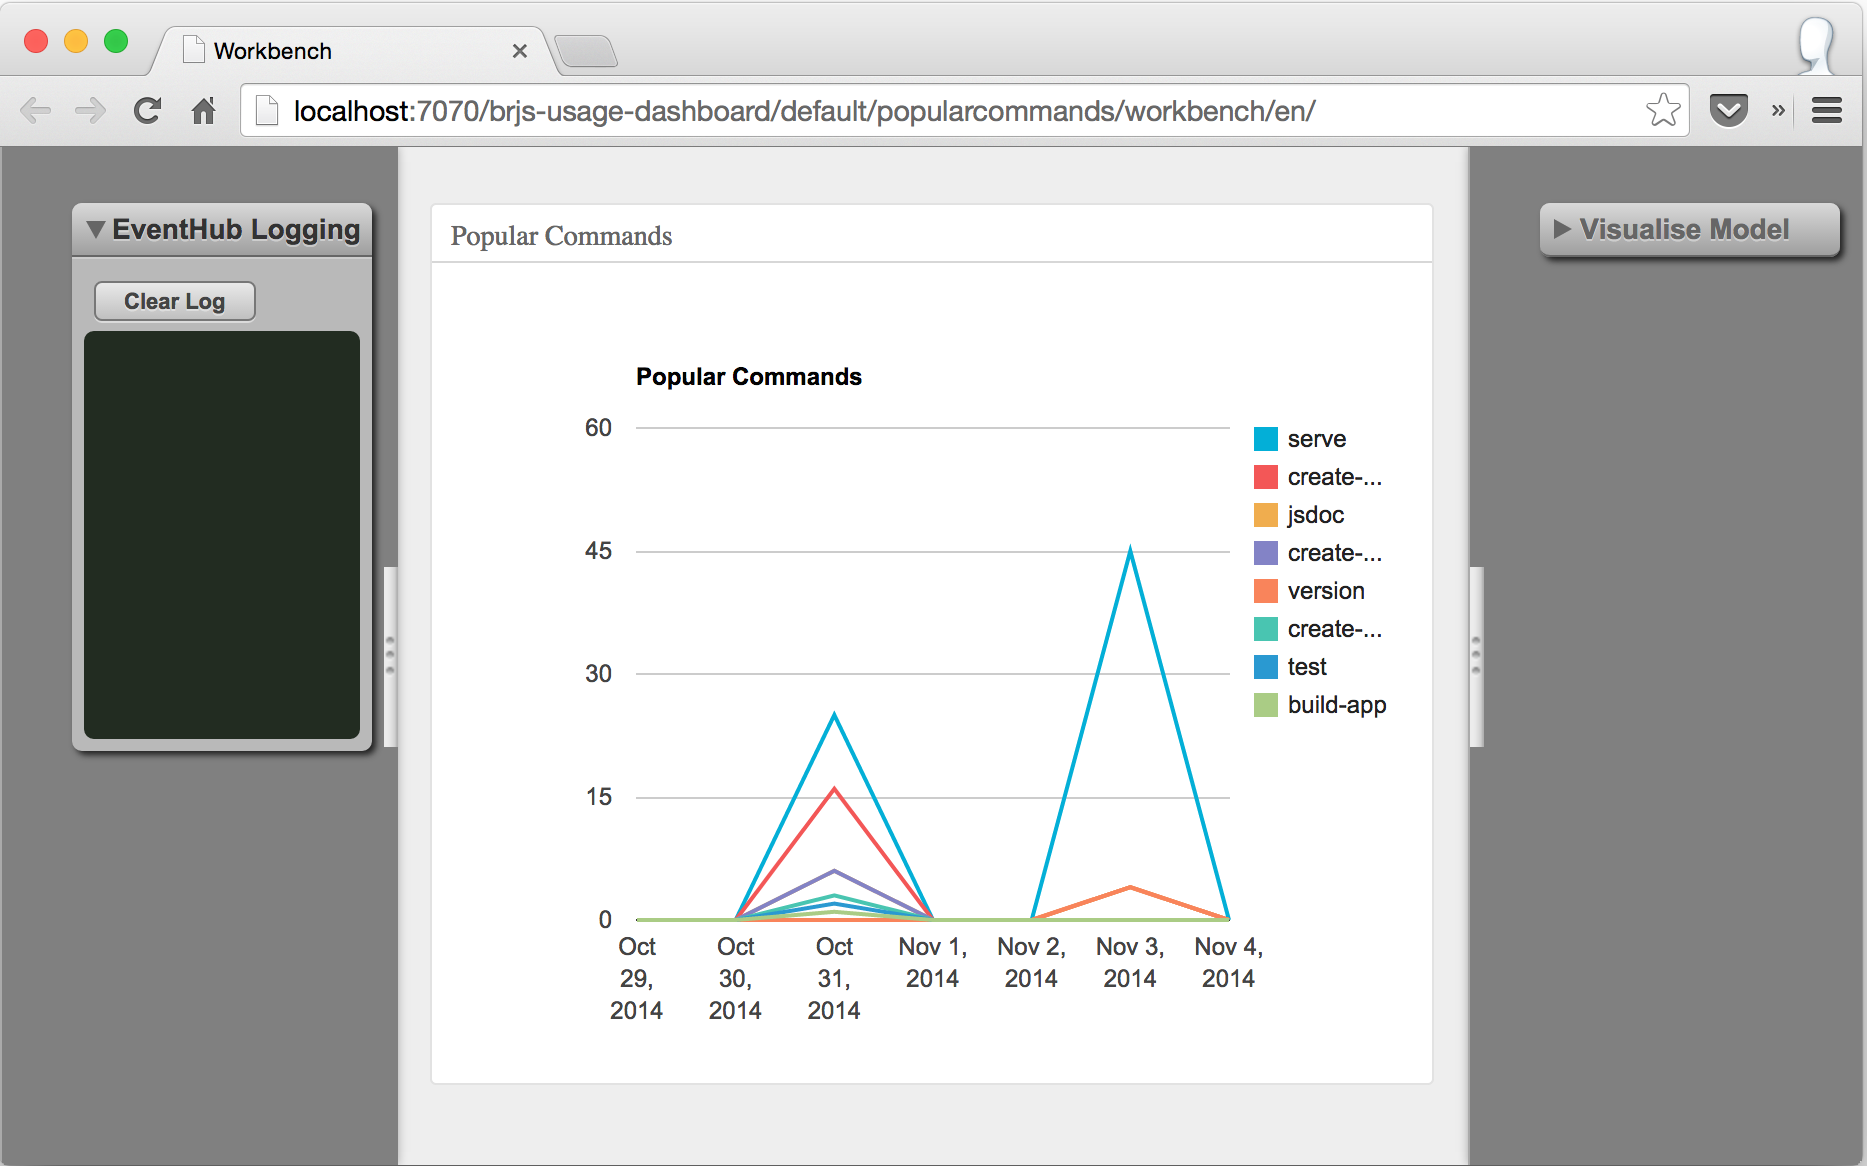 The Popular Commands Blade Running in a Workbench
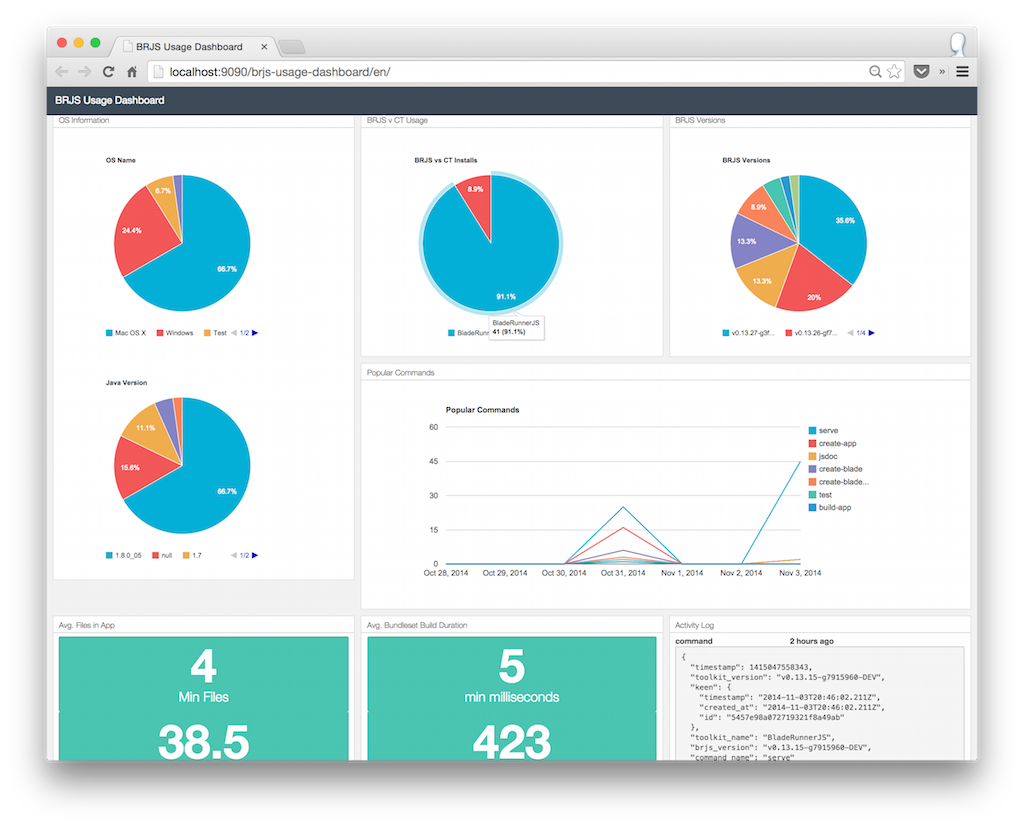
Once the blades were complete we could pull them into the application. In the following image you can see each blade now pulled into the full application:
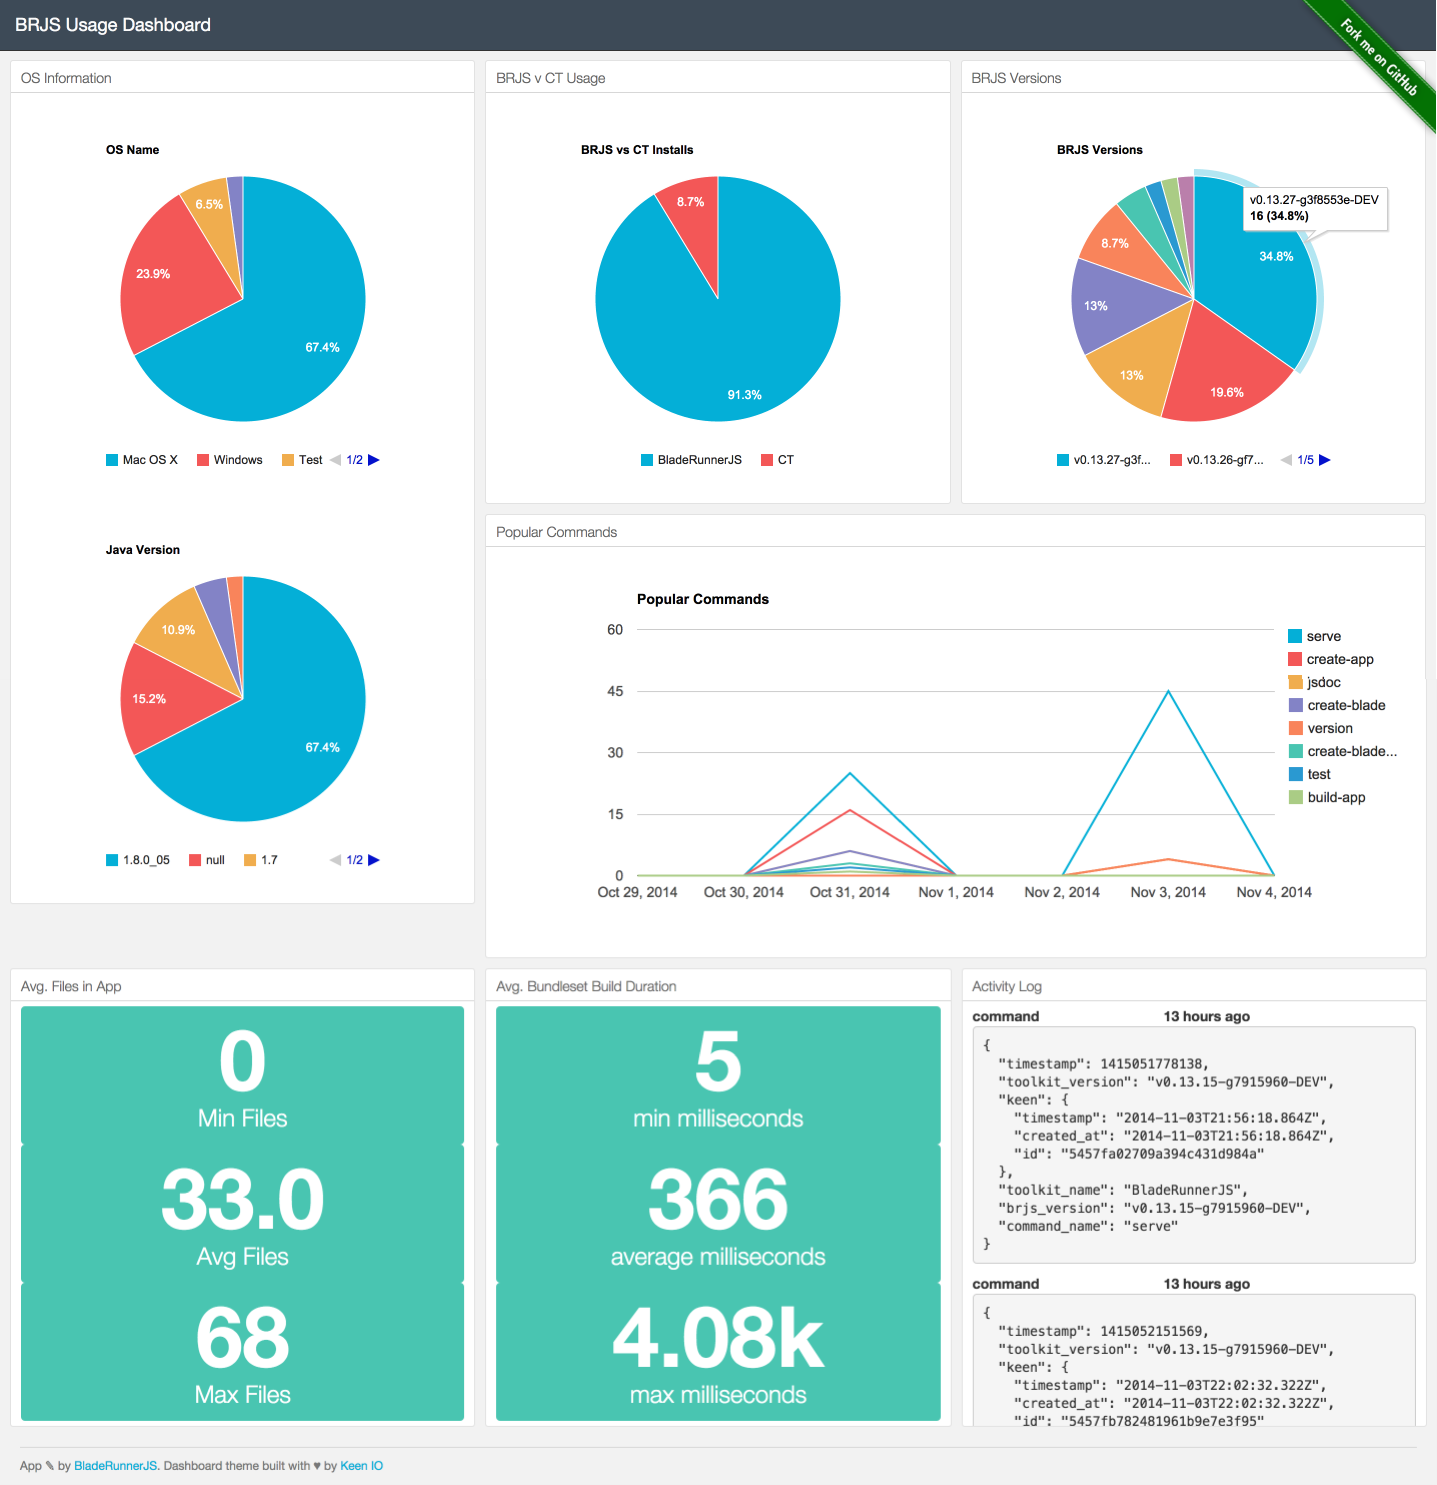
Keen IO does lots for us. And after calling their API from the BRJS toolkit the data is instantly updated in their system. However, those changes aren't instantly reflected in the web dashboard.
So, the next step is to use Pusher to send an event from the toolkit to the dashboard to tell it that new data is available. The dashboard can then update the appropriate Keen IO visualisation.
In order to do this we used the pusher-rest-java library. Once the library is referenced, sending an update to Pusher is as easy as adding an import statement and two lines of code:
private void trackEvent(Map<String,Object> eventData, String eventType) {
    try
    {
        String jsonBlob = new Gson().toJson(eventData);
        HttpClient client = HttpClientBuilder.create().build();
        HttpPost keenIOPost = new HttpPost("https://api.keen.io/3.0/projects/" + KEENIO_PROJECT_ID + "/events/" + eventType + "?api_key=" + KEENIO_APP_KEY);
        keenIOPost.setHeader("Content-Type", "application/json");
        keenIOPost.setEntity( new StringEntity(jsonBlob) );
        client.execute(keenIOPost);

        /*** new code ***/
        Pusher pusher = new Pusher(PUSHER_APP_ID, PUSHER_APP_KEY, PUSHER_APP_SECRET);
        pusher.trigger(eventType, "new-stat", eventData);
        /*** end of new code ***/
    }
    catch (Exception e)
    {
        brjs.logger(this.getClass()).error(e.toString());
    }
}
In the code above we're using the eventType as a channel so that each blade in the dashboard can subscribe to updates related to the data it is displaying e.g. the OS Information visualisation will just subscribe to the installs channel. The event we're triggering is called new-stat and we'll also send the event data. However, since we're using Keen IO to do the visualisations we probably won't use the data in anything other than the Activity log blade.
In the web dashboard we want to connect to Pusher and each blade should subscribe to the appropriate channel. Using Pusher's JavaScript library this is achieved by referencing the library and then using the following highlighted code:
var client = new Keen( { projectId: KEEN_PROJECT_ID,
                                                 readKey: KEEN_READ_KEY } );

var query = new Keen.Query('count', {
        eventCollection: 'installs',
        groupBy: 'os_name'
    });

/*** new code ***/
var request = client.run( query, function() {
/*** end of new code ***/
    new Keen.Visualization( this, document.getElementById( 'os-info-name' ), {
            chartType: 'piechart',
            title: 'OS Name',
            width: 'auto'
    } );
} );

/*** new code ***/
var pusher = new Pusher( PUSHER_APP_KEY );
var channel = pusher.subscribe( 'installs' );
channel.bind( 'new-stat', function() {
    // Update the visualisation
    request.refresh();
} );
/*** end of new code ***/
The working example below is exactly the same as the previous example with the exception that it will update when new data becomes available, courtesy of Pusher.
You can use this button to fake a new event being received from Pusher and to test the visualisation refreshing
By adding Pusher to the mix the dashboard is always up to date with the latest toolkit usage information.
One of the potential problems with the examples above is that our blades are tightly coupled to both of the services we've chosen to use in this application - Keen IO and Pusher. With an application of this size there won't be a massive overhead if we decided to use alternative services (obviously that would never happen with these amazing service). However, if it were a large application the service abstraction would really help as the only code changes necessary would be within the service implementations. Also, directly using the objects defined in third-party libraries does make it difficult to test in isolation which can be a pain no matter the size of your app.
directly using the objects defined in third-party libraries does make it difficult to test in isolation
The solution here is to create a service abstraction that will make it much easier for us to control what our blade code is interacting with. That way we can substitue the code that interacts with the third-party libraries with code that helps us test our blade functionality. That's where services come in really handy.
So, instead of our code looking as follows, where there are lots of interactions with third party libraries:
/*** new code ***/
var client = new Keen( { projectId: KEEN_PROJECT_ID,
                         readKey: KEEN_READ_KEY } );
/*** end of new code ***/

/*** new code ***/
var query = new Keen.Query("count", {
/*** end of new code ***/
    eventCollection: 'installs',
    groupBy: 'os_name'
  });

var request = client.run( query, function() {
  /*** new code ***/
  new Keen.Visualization( this, document.getElementById( 'os-info-name' ), {
  /*** end of new code ***/
      chartType: 'piechart',
      title: 'OS Name',
      width: 'auto'
  } );
} );

/*** new code ***/
var pusher = new Pusher( PUSHER_APP_KEY );
/*** end of new code ***/
var channel = pusher.subscribe( 'installs' );
channel.bind( 'new-stat', function() {
  request.refresh();
} );
It can instead to do something like the following, remove that tight coupling and in doing so we actually remove some of the code that would have been duplicated between blades too:
var ServiceRegistry = require( 'br/ServiceRegistry' );
var service = ServiceRegistry.getService( 'stats.service' );

/*** new code ***/
var query = service.buildQueryQuery("count", {
/*** end of new code ***/
    eventCollection: 'installs',
    groupBy: 'os_name'
  });

/*** new code ***/
var request = service.executeQuery( query, function() {
/*** end of new code ***/
  /*** new code ***/
  service.createVisualisation( this, document.getElementById( 'os-info-name' ), {
  /*** end of new code ***/
      chartType: 'piechart',
      title: 'OS Name',
      width: 'auto'
  } );
} );

/*** new code ***/
service.on( 'new_install', function() {
/*** end of new code ***/
  request.refresh();
} );
You can see the full service definition here
Finally, in order to make this code really easy to test we should move it into an object definition:
var ServiceRegistry = require( 'br/ServiceRegistry' );

function OSInformation() {
    this._statService = ServiceRegistry.getService( 'stat.service' );

    // Operating systems that BRJS has been installed on
    var osName = this._statService.buildQuery("count", {
        eventCollection: 'installs',
        groupBy: 'os_name'
    });

    this._osNameRequest = this._statService.executeQuery(osName, this._osNameExecutionComplete.bind( this ) );

    this._statService.on( 'new_install', this._updateStats.bind( this ) );
}

OSInformation.prototype._osNameExecutionComplete = function() {
    this._statService.createVisualisation(
        this._osNameRequest,
        document.getElementById("os-info-name"),
        {
            chartType: 'piechart',
            title: 'OS Name',
            width: 'auto',
            chartOptions: {
                legend: { position: 'bottom' },
            }
        }
    );
};

OSInformation.prototype._updateStats = function() {
    this._osNameRequest.refresh();
};

module.exports = OSInformation;
You can see the full object definition here
The tests we can now easily perform are:
service.buildQueryservice.executeQueryservice.createVisualisationnew_install updates: service.on( 'new_install', ... )new_install event is triggered that the request is updated: request.refresh()request.refresh() results in a new visualisation being created: service.createVisualisationIt would be really difficult to do this level of testing without the service abstraction and the control that it offers.
Ok, enough of the deep-dive. Let's get back to the fluffy stuff and have a think about how we can use this data. We're collecting quite a bit of data so let's stick to a Top 5:
Firstly, it'll tell us if anybody is actually using BladeRunnerJS. Of course, we'll automatically get developers using BRJS since Caplin Trader developers - Caplin Systems employees and our customers - will be using BRJS. But it'll be great to find out if anybody outside of Caplin's existing network uses BRJS.
We can take a look at the download figure for the BRJS release that includes tracking (maybe v0.14 or v1.0) and then tally that up with the collected installs stats. This may highlight that there's a barrier to entry which is stopping downloads converting into the toolkit even being used. Is Java a big barrier? We'll obviously have to take into account that a number of developers will answer No to the anonymous data collection question.
The Popular Commands data will be really useful in identifying the commands that developers frequently use. Based on that information we can consider improving popular commands and dropping commands that aren't being used at all.
You'll notice a glaring ommission. We're not presently collecting errors or exceptions. This needs a bit more thought but right now I'm breaking down these as follows:
User Errors are problems with application code that can be picked up by the toolkit. This can be really handy in helping us identify common mistakes developers are making. From this we can look at making is easier to avoid these common errors. An example might be that people may put the blades directory in require paths in their code. If that happens we may need to do something about it.
Exceptions are problems that the toolkit has experienced. For example, we don't have any BRJS crash reports right now. But that doesn't mean that there won't be edge cases where that could happen.
There could be a bit of cross-over between these two. But I'm very keen for us to start collecting this data ASAP.
My hunch is that Windows will top the list for BRJS. That's because I know a lot of developers at Caplin use Windows and I'm pretty sure our customers do too. I think the value here will really be to identify the types of organisations that use BRJS.
Adding anonymous usage tracking to the BladeRunnerJS toolkit was lots of fun. I love taking advantage of really powerful hosted services like Keen IO and Pusher and you can see just how easy they've made an otherwise more complex set of tasks.
The more data we have the more real insights we'll have into everything about BRJS: onboarding process, the usage, how we can improve BRJS and much, much more.
I'm also very hopeful that a reasonable number of developers will answer Yes to the anonymous data collection request. The more data we have the more real insights we'll have into everything about BRJS: onboarding process, the usage, how we can improve BRJS and much, much more.
BladeRunnerJS is of course open source. So you can dig into the plugin code and see how we've achieved the tracking functionality in full detail (right now it's in the this branch). You can also take a look at the BRJS Usage Dashboard application code that was itself built using the BladeRunnerJS toolkit. You can also see live stats in a deployed version of the BRJS Usage Stats app.